Social Housing Plan - Number of households living in social housing in Geelong
There are 3,300 households recorded as living in social housing in Geelong (ABS, 2016). This comprises about two thirds public housing and one third community housing.
The number of households renting social housing has stayed relatively constant since 2001, while population has grown by 24%, and the number of households has grown by about 10% (Figure 9).
This reflects increasing demand for social housing without a commensurate increase in social housing stock. As a result, the proportion of households renting social housing has dropped from 4.2% (2011) to 3.6% (2016).
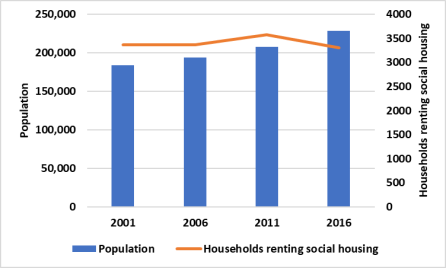
Figure 9: Number of Households Renting Social Housing - 2001-2016
Source: ABS, 2016
In the period 2011 – 2016 there were increases in all housing tenures, except for social housing (Figure 13). Importantly, the number of households renting privately increased by 3,500 households (nearly 20%) from 2011 to 2016.
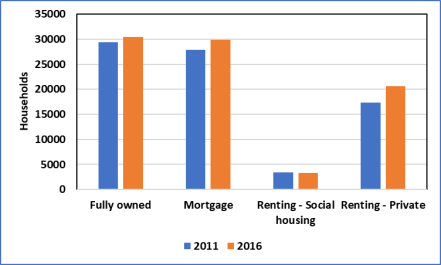
Figure 10: Housing Tenure - 2011–2016
Source: ABS 2016
Social housing areas in Geelong
The distribution of social housing across Geelong is very uneven. This is a remnant of the post war development of housing, for employees in Geelong’s industries, and in particular the investment in public housing by the State Government, to create new suburbs at East Geelong, Norlane and Corio.
Five Areas account for nearly 84% of social housing tenants in Geelong. By contrast there is relatively little social housing on the Bellarine Peninsula, and in the growth area of Armstrong Creek.
Table 9: Areas with relatively high proportion of social housing
| Area | Suburbs | Proportion of all social housing tenants | Social housing as a proportion of all housing |
|---|---|---|---|
| 13 | Corio, Norlane | 40% | 14% |
| 6 | Newcomb, South Geelong, St Albans, and Whittington | 20% | 8% |
| 7 | Grovedale, Waurn Ponds | 8% | 4% |
| 8 | Belmont, Highton | 9% | 2% |
| 10 | Geelong West, Newtown | 7% | 3% |
| Other | 16% | ||
| Total | 100% |
Source: ABS, 2016
This high concentration of social housing in particular areas has contributed to higher levels of disadvantage in Corio, Norlane and the Whittington area.
The expressed unmet demand (social housing waiting lists
The number of households on the social housing waiting list provides complementary information about the demand for social housing. Households on the waiting list are likely to be experiencing housing stress, or homelessness.
Table 10: Number of Households on Social Housing Waiting List - 2018
| Area (office) | Priority Access | Register of Interest | Total |
|---|---|---|---|
| Barwon (Geelong) | 1,610 | 1,089 | 2,699 |
Source: DHHS, Dec 2018
Table 11: Number of Households on the Office of Housing Transition List December - 2018
| Area (office) | Priority Access | Register of Interest | Total |
|---|---|---|---|
| Barwon (Geelong) | 206 | 189 | 395 |
Source: DHHS, Dec 2018
As indicated the number of households on the waiting list is the ‘expressed demand’, and does not represent the actual demand for social housing. There are many households in rental stress who do not register, because they are aware of the significant waiting times, or because they wish to avoid the perceived stigma of becoming a public housing tenant.