Audit data
GEAP - Appendix one
The Commission for Gender Equality in the Public Sector released additional guidance relating to the audit data that should be included in this action plan. The Commission provided guidance for minimum standards and requirements as well as a guide for additional information. The data below will be broken down according to these standards.
Gender+ Survey
64 percent% of all respondents were women, 33 percent% of all respondents were male. When reading our response rates to the survey questions, please keep in mind that results have been provided as both a proportion of total respondents, as well as a proportion of two major gender groups.
1. Gender composition of our workforce
| 1.1 Overall gender composition of the organisation | ||
|---|---|---|
| Women | Men | Self described |
| 64% | 36% | 0.04% |
| 1.2 Workforce by employment basis | ||
| Employment basis | Women | Men |
| Full-time | 50% | 50% |
| Part-time | 91% | 9% |
| Casual | 86% | 14% |
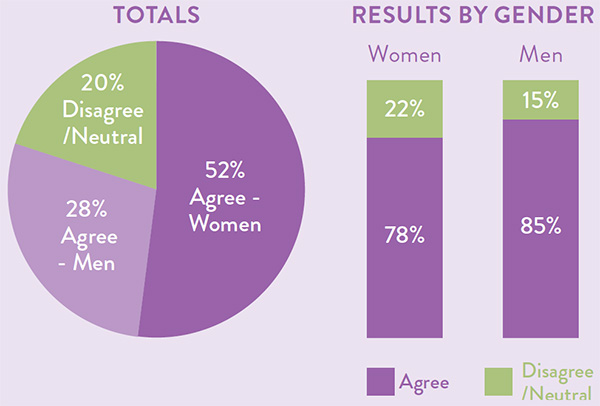
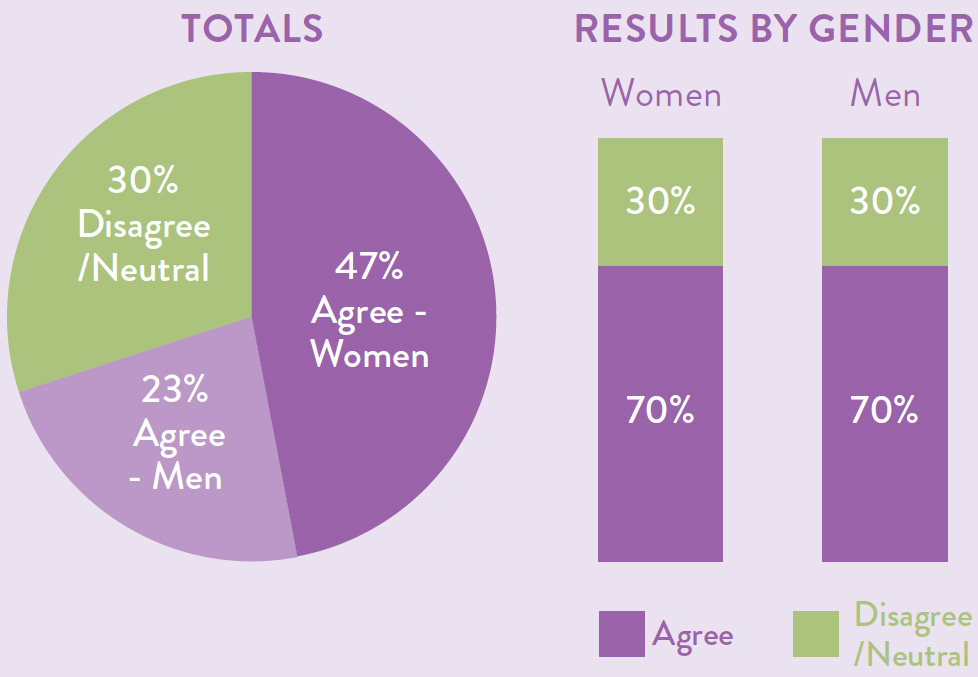
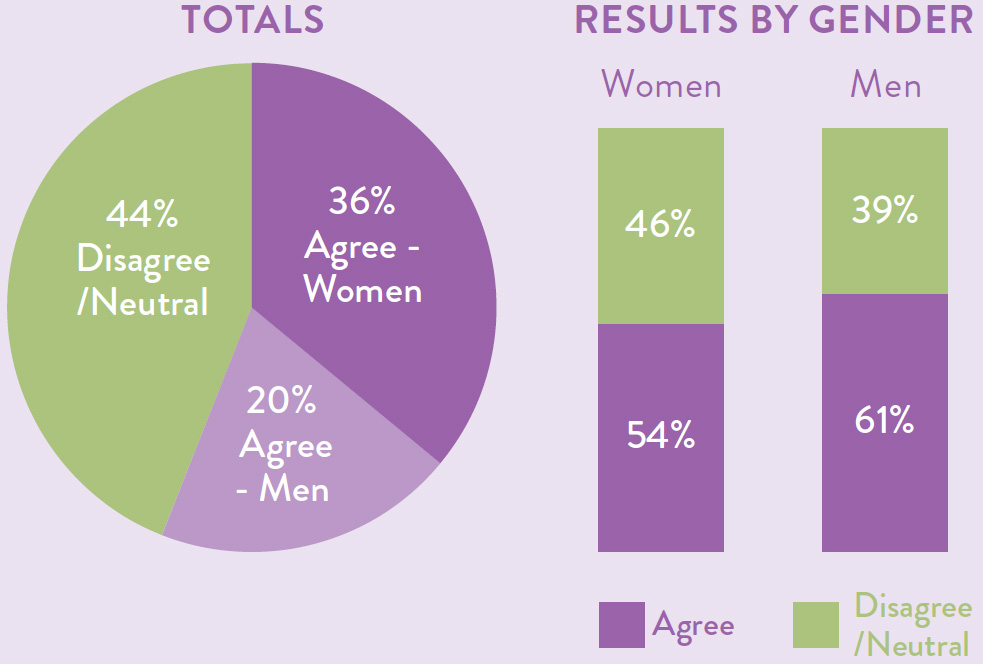
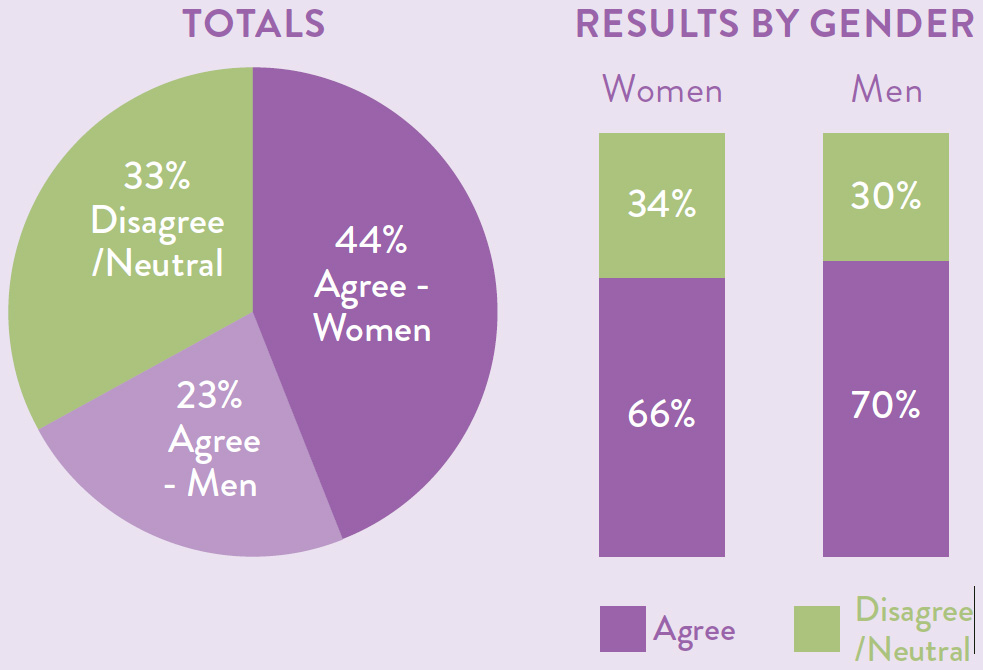
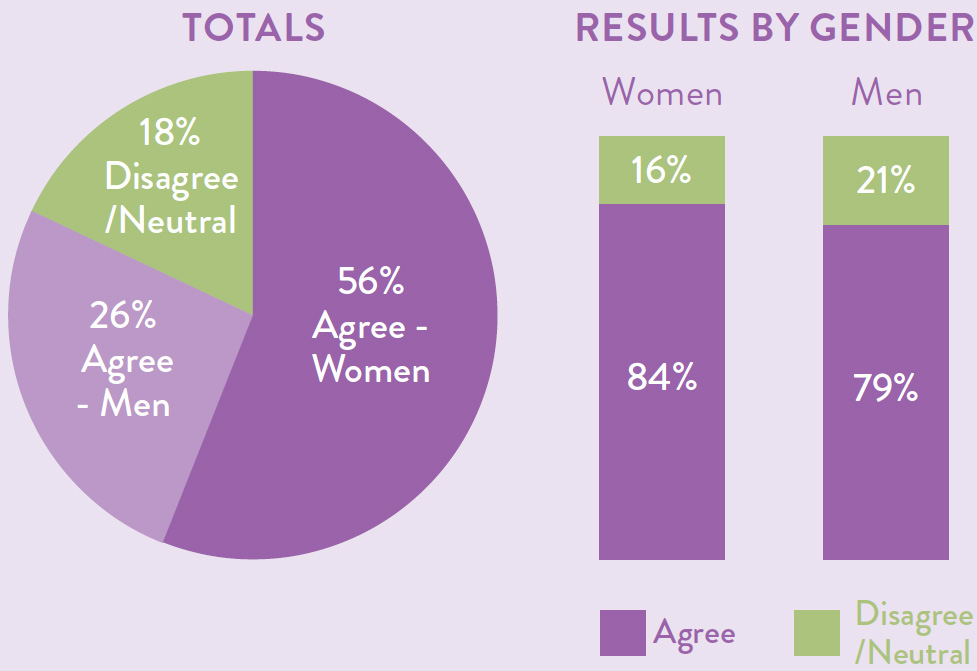
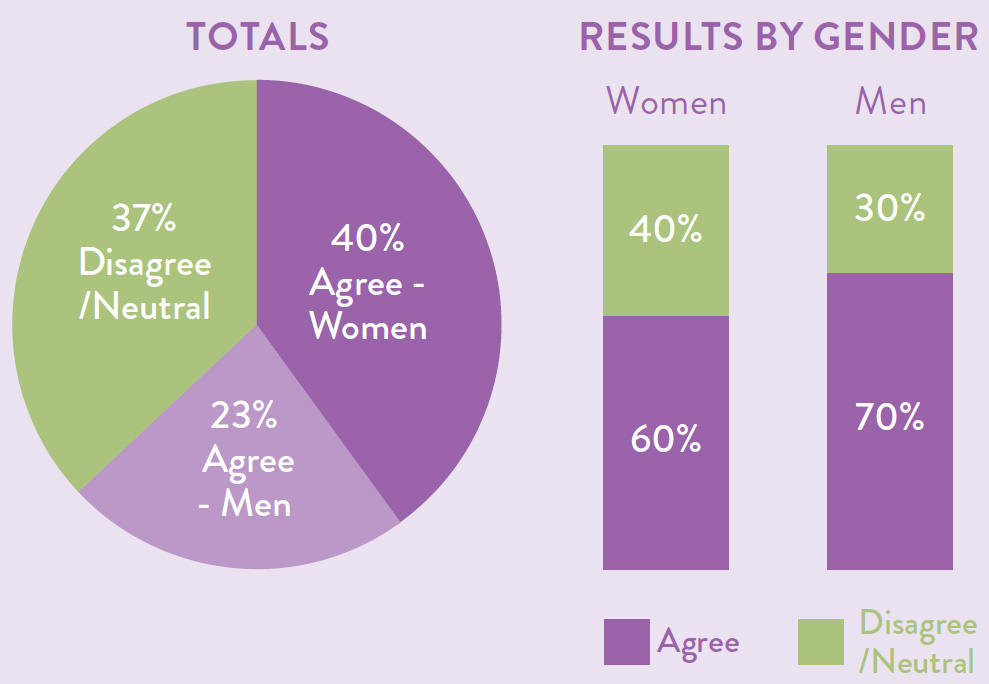
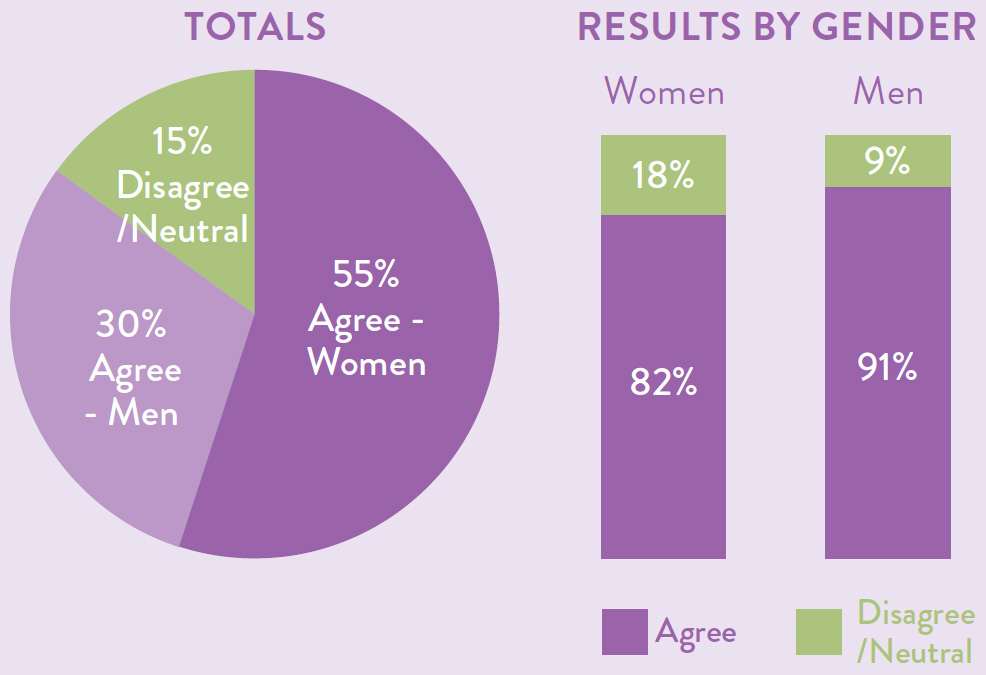
| 1.3 There is a positive culture within my organisation in raltion to employees of different genders/sexes | ||
 | ||
| 1.4 Gender composition of the workflorce by level to CEO | ||
| Level | Women | Men |
| CEO | 0% | 100% |
| -1 | 52% | 48% |
| -2 | 60% | 40% |
| -3 | 45% | 55% |
| -4 | 59% | 41% |
| -5 | 70% | 30% |
| -6 | 78% | 22% |
| 1.5 Workforce by employment basis | ||
| Employment basis | Women | Men |
| Full-time | 50% | 50% |
| Part-time | 91% | 9% |
| Casual | 86% | 14% |
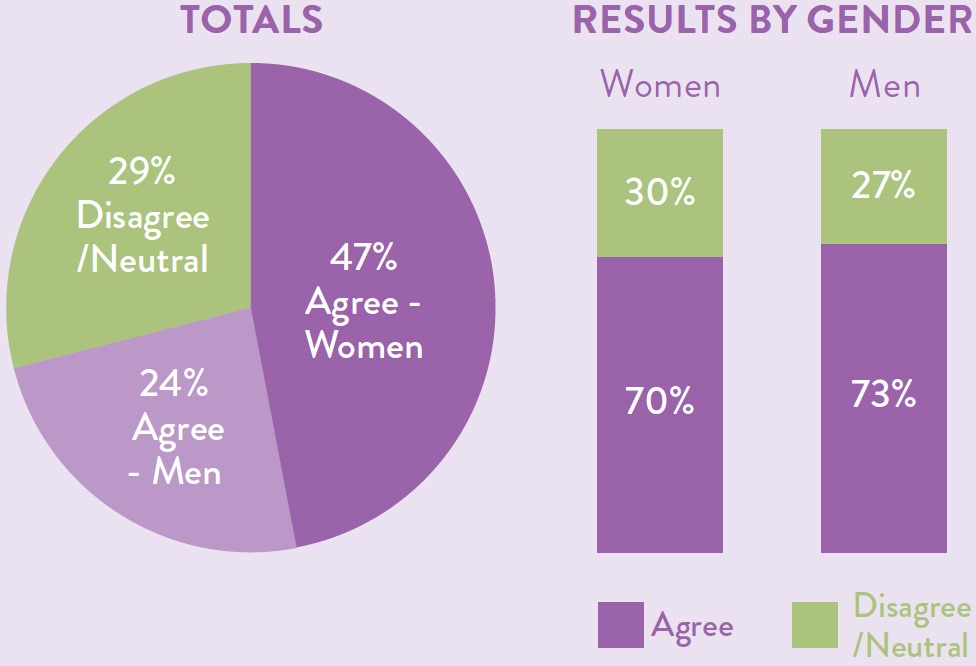
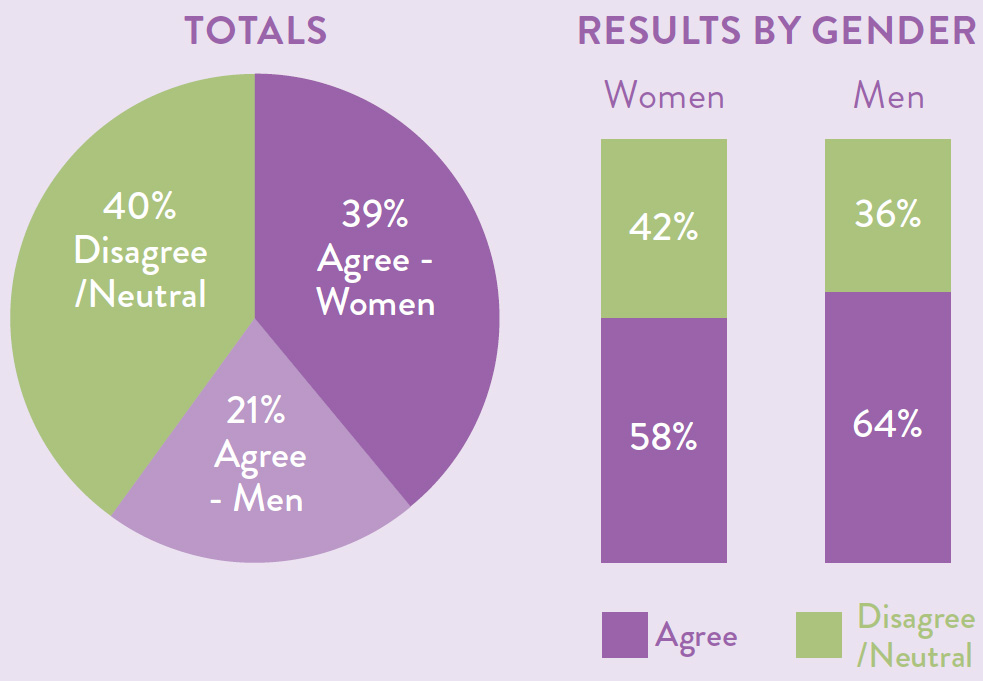
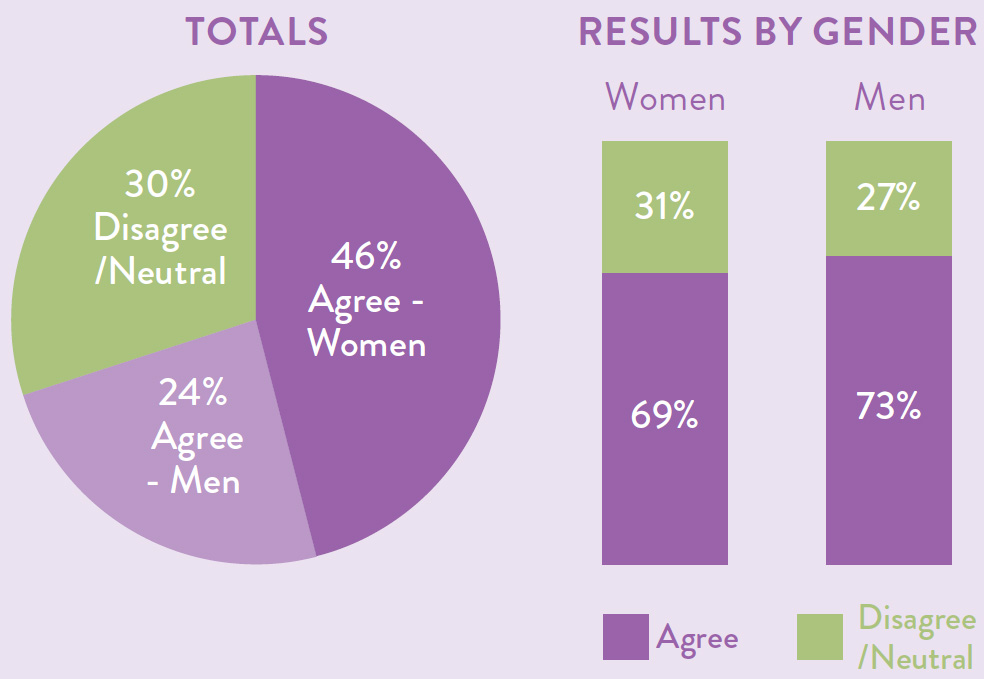
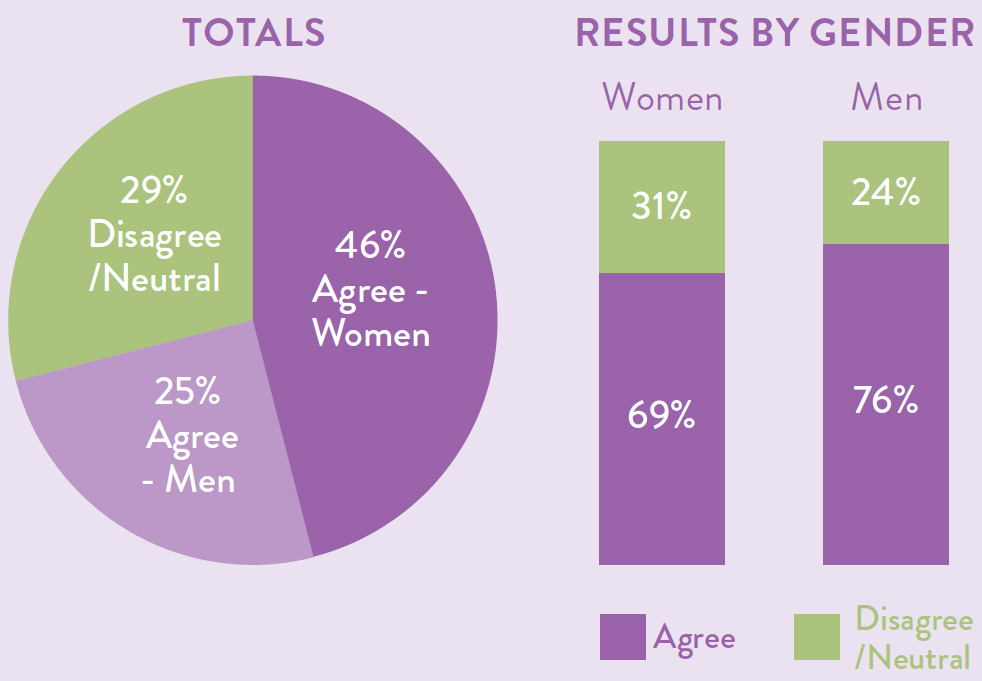
| 1.6 There is a positive culture within my organisation in relation to employees who are Aboriginal and/ or Torres Strait Islander | ||
 | ||
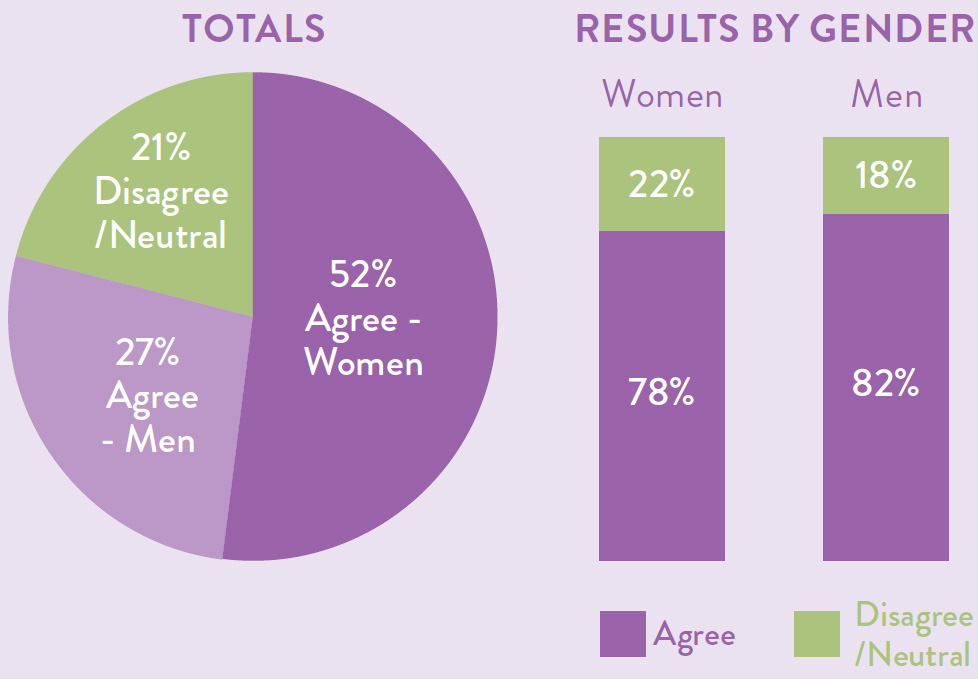
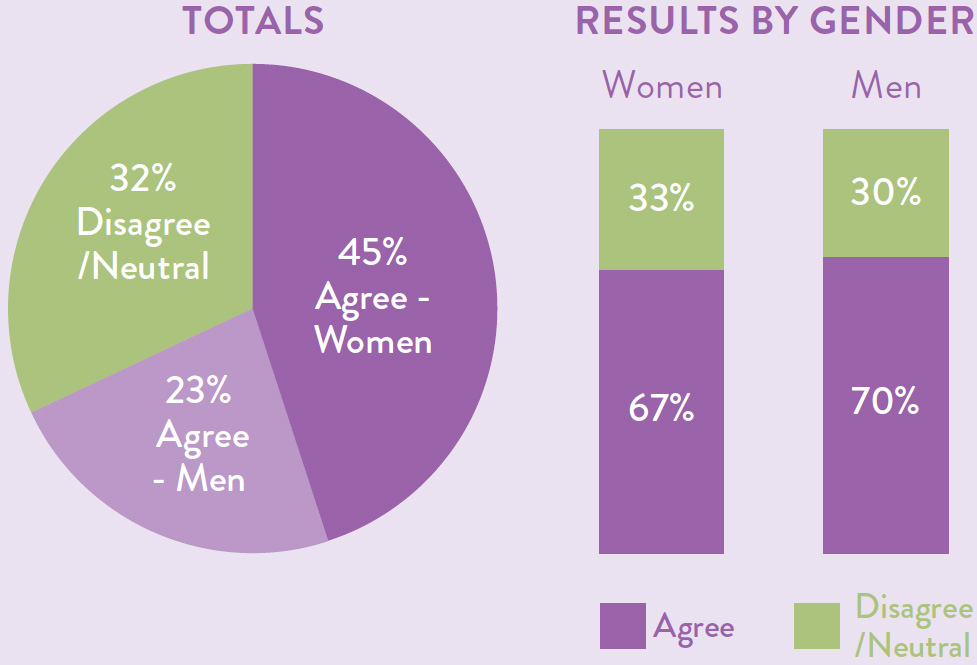
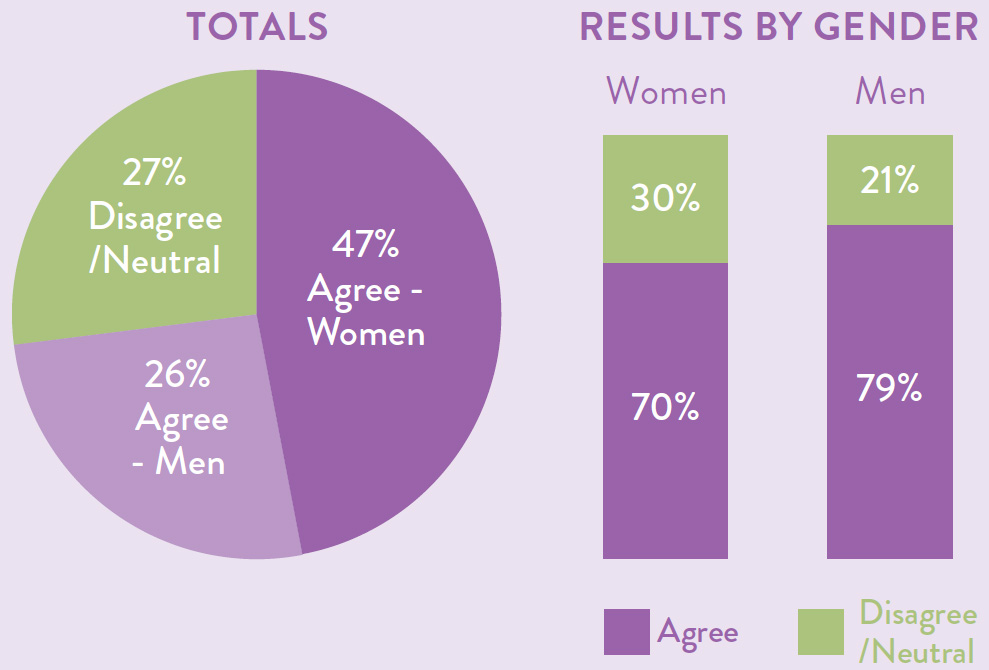
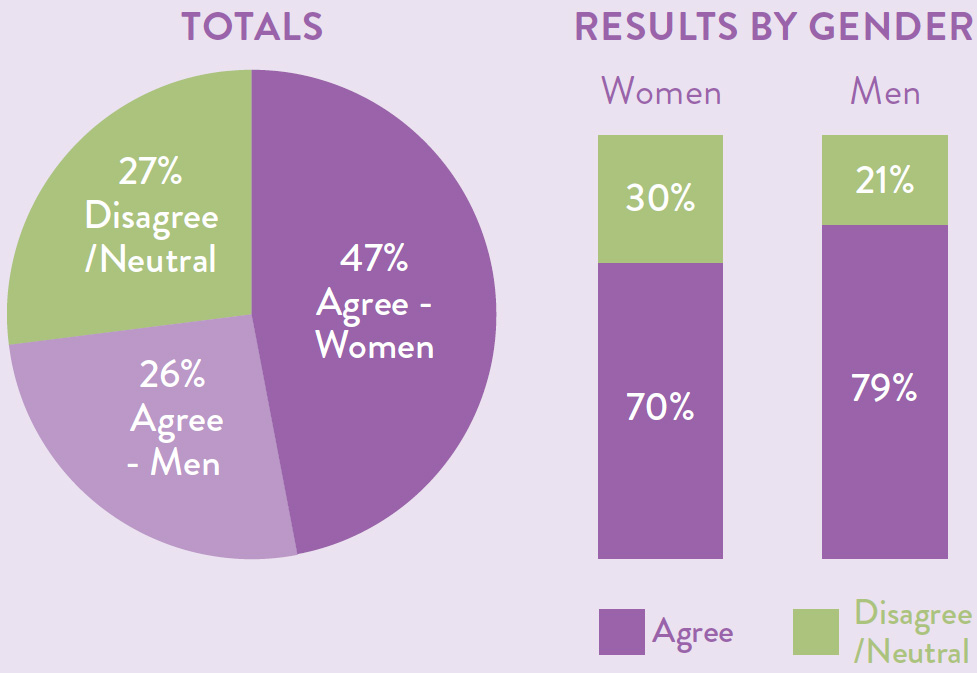
| 1.7 There is a positive culture within my organisation in relation to employees from varied cultural backgrounds | ||
 | ||
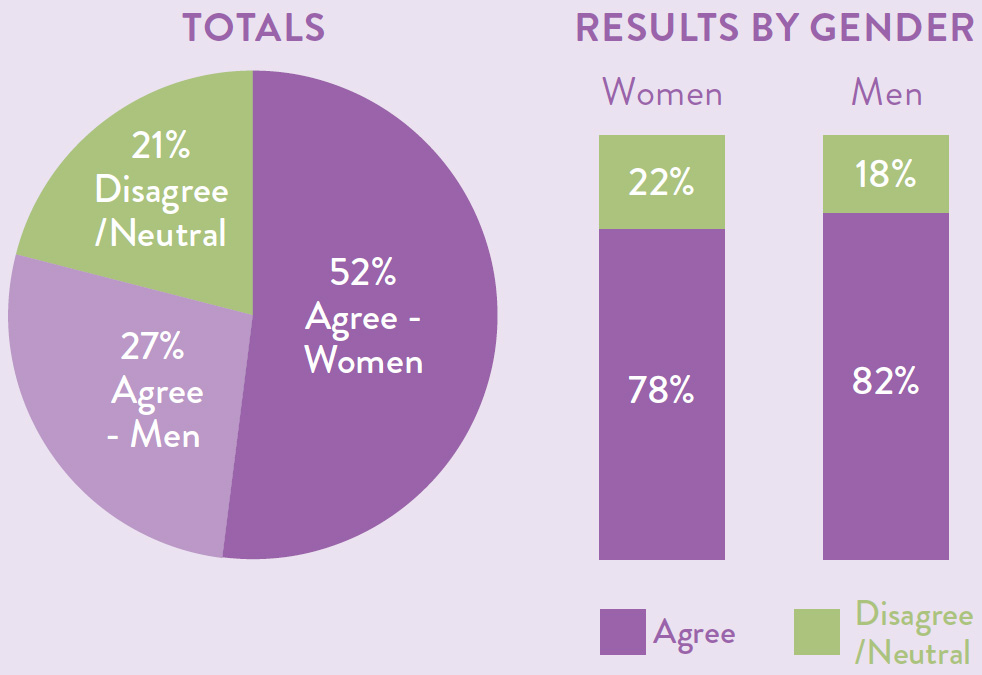
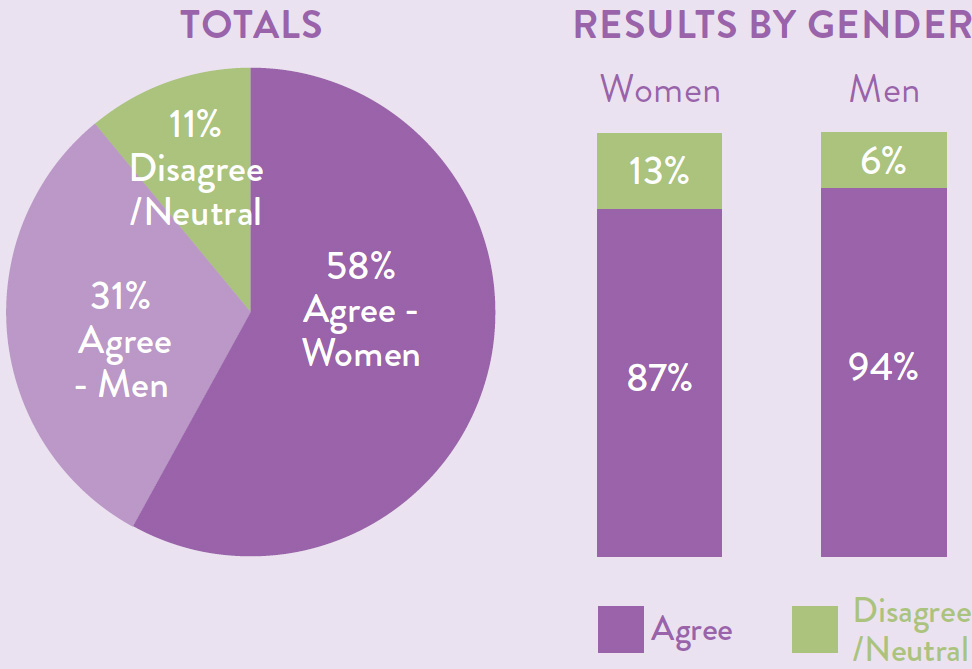
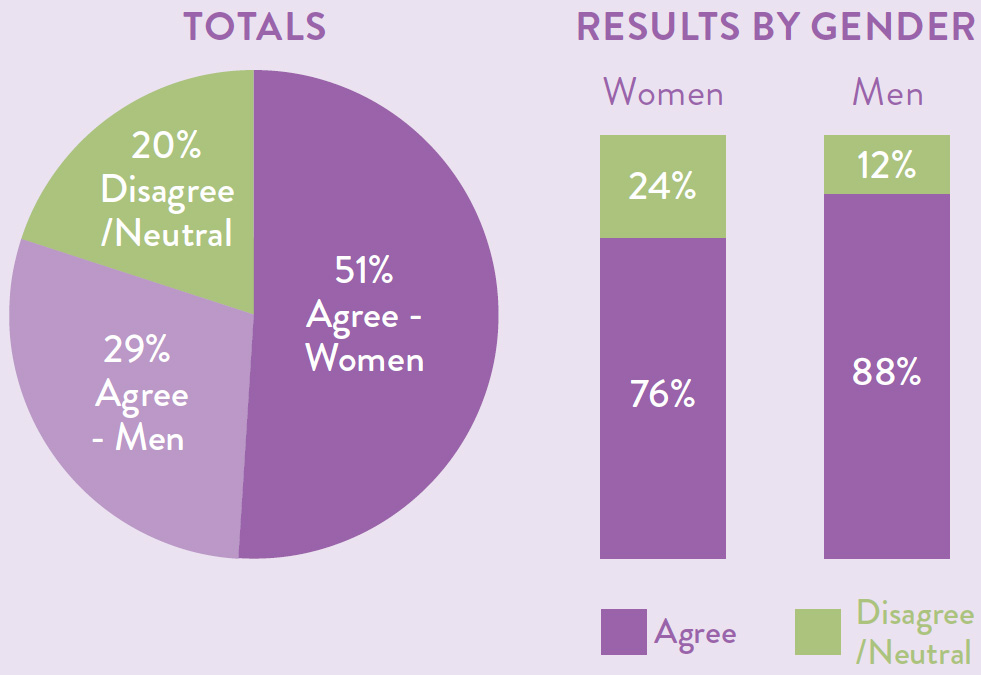
| 1.8 There is a positive culture within my organisation in relation to employees of different age groups | ||
 | ||
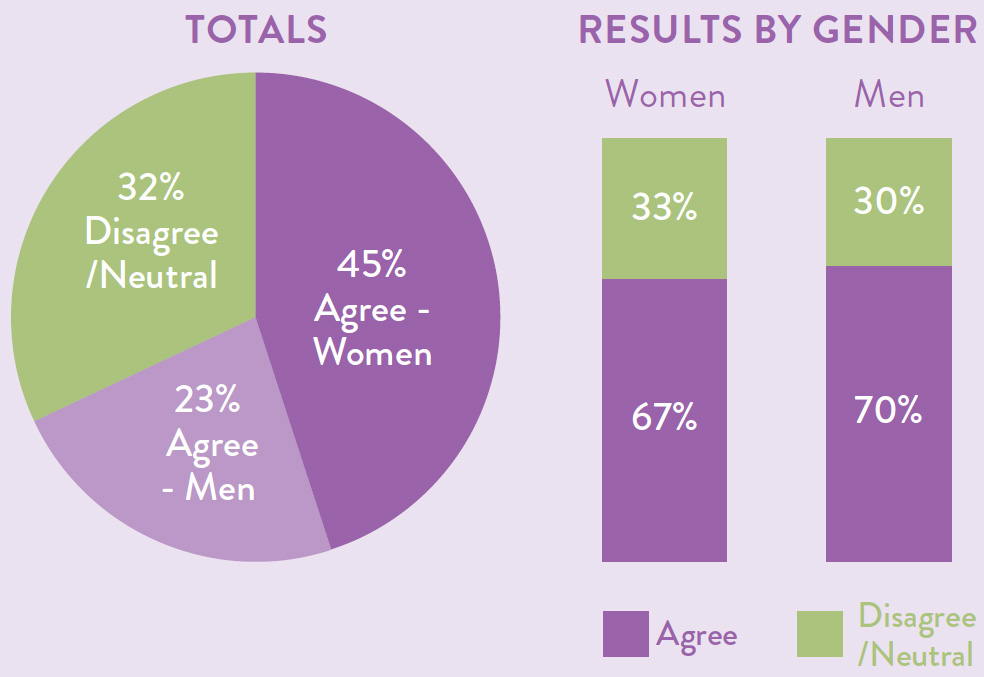
| 1.9 There is a positive culture within my organisation in relation to employees who identify as LGBTIQ | ||
 | ||
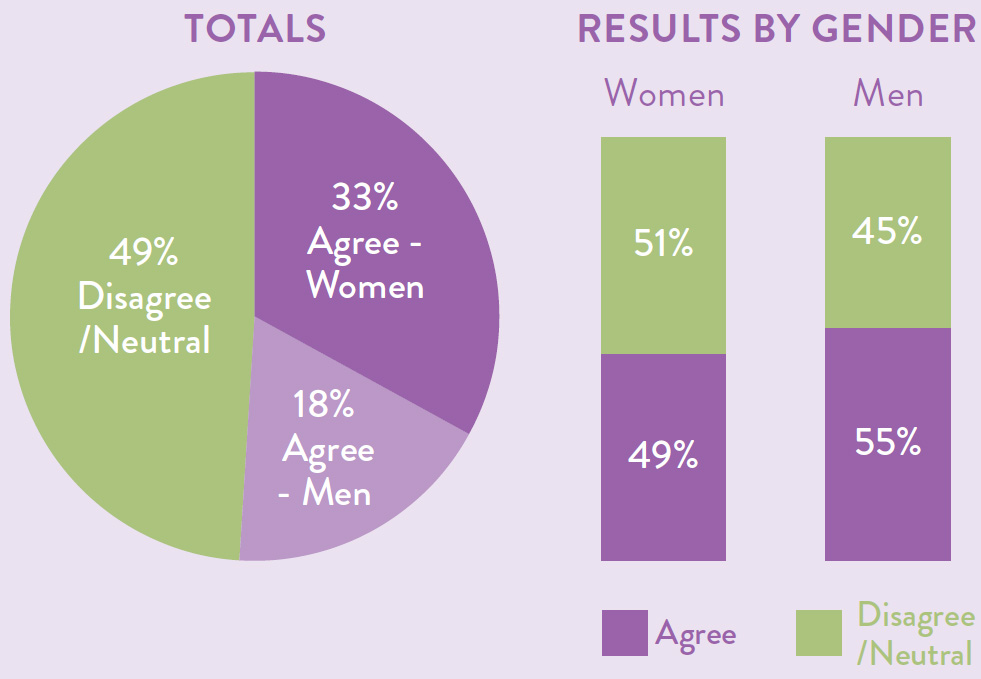
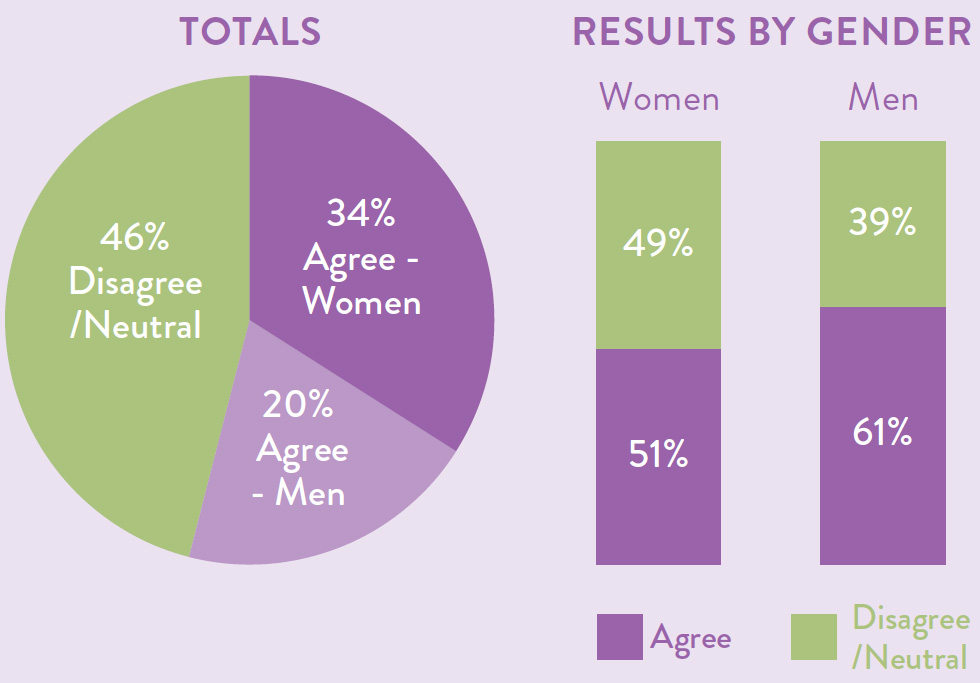
| 1.10 There is a positive culture within my organisation in relation to employees with disability | ||
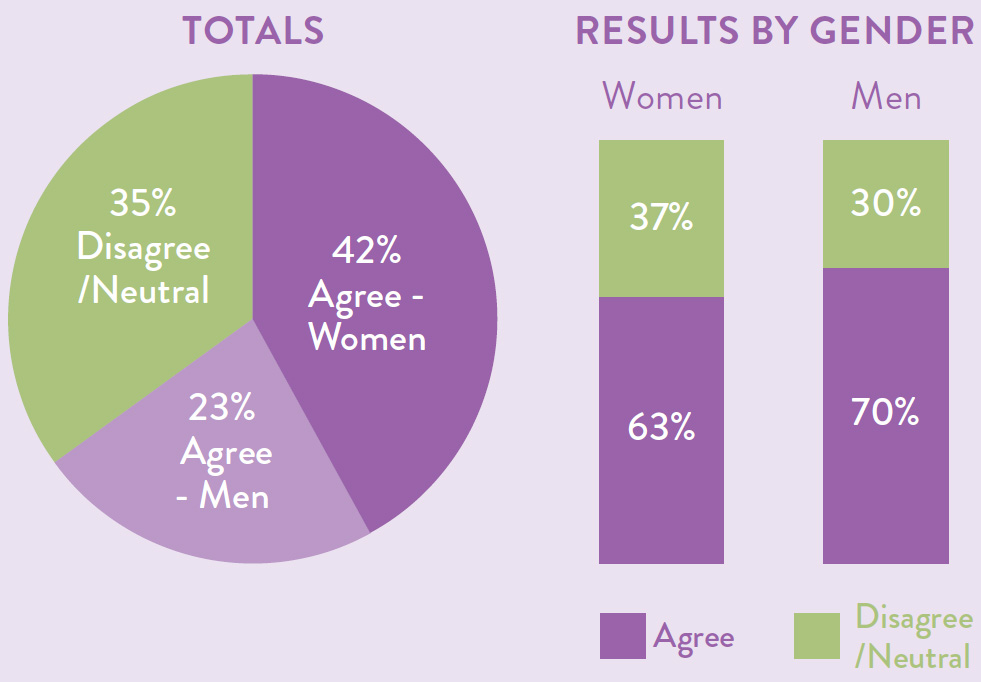 | ||
Overall, we have a strong agreeance from our Gender+ Survey respondents about our organisations positive culture, however respondents have identified areas that could be improved and they are in regard to employees from an Aboriginal and Torres Strait Islander background and employees with disabilities.
These two groups are not represented very strongly in our workforce at present and have been identified as areas of focused improvement.
We will build on this positive culture to improve the inclusion and representation of First Nations people, people from the LGBTIQ community, and people living with disabilities across our workforce and leadership groups.
2. Pay equity
| 2.1 Gender pay gaps | ||||||
|---|---|---|---|---|---|---|
| Median base salary gap | Median total remuneration gap | |||||
| 2.1% | 4% | |||||
| *Note 0.0% would indicate no gender pay gap | ||||||
| 2.2 Pay gap according to level from CEO | ||||||
| Level | ||||||
| CEO | 0.0% or N/A | |||||
| Senior Officer | 6.3% | |||||
| Band 8 | 6.2% | |||||
| Band 7 | 3.3% | |||||
| Band 6 | 0.0% | |||||
| Band 5 | 0.0% | |||||
| Band 4 | 0.0% | |||||
| Band 3 | 0.0% | |||||
| Band 2 | 0.0% | |||||
| Band 1 | 0.0% | |||||
| 2.3 Pay gap according to employment status | ||||||
| Status | Women | |||||
| All | 2.1% | |||||
| Full-time permanent/ongoing | 0.0% | |||||
| Full-time contract (fixed term) | 14.5% | |||||
| Part-time permanent/ongoing | 4.2% | |||||
| Part-time contract (fixed term) | 4.8% | |||||
| Casual | 0.0% | |||||
| Note 0.0% indicates no gender pay gap Number < 0 denotes pay gap favouring men Number > 0 denotes pay gap favouring women Please note that our pay gap according to employment status is good at only 2.1%. The pay gap favours women in the part-time ongoing space which corresponds to us having such a large female dominated part-time workforce. Areas for further review and improvement is in the fixed term categories, where it would seem that the disparity could be linked to salary negotiations, gender stereotypes and perhaps additional allowances. | ||||||
| 2.4 Median pay gap according to age and level from CEO | ||||||
| Age | 15–24y | 25–34y | 35–44y | 45–54y | 55–64y | 65+ |
| CEO | ||||||
| Senior Officer | 2.4% | 9.7% | 8.3% | |||
| Band 8 | 5.5% | 0.4% | 2.0% | 7.1% | 4.5% | |
| Band 7 | 0.1% | 2.8% | 0.3% | 4.4% | 4.7% | |
| Band 6 | 0.2% | 1.1% | 1.1% | 7.0% | -0.6% | |
| Band 5 | -14.9% | -1.1% | -0.9% | 1.5% | 0.6% | 1.3% |
| Band 4 | 0.3% | 0.4% | 1.3% | 2.6% | 0.3% | 2.5% |
| Band 3 | 0.3% | 0.6% | 6.6% | 0.4% | 8.4% | 4.5% |
| Band 2 | 0.1% | 2.7% | 4.8% | 0.0% | 1.4% | 3.2% |
| Band 1 | -.5% | -6.5% | -4.9% | |||
| Please note that some of these outlying figures are due to small numbers of people in those age categories, however you are able to observe that there are some persistent disparities from 35+ years of age. | ||||||
| 2.5 Median pay gap according to age and employment basis | ||||||
| Age | 15–24y | 25–34y | 35–44y | 45–54y | 55–64y | 65+ |
| ALL | 1.1% | 5.3% | 9.5% | 14.1% | 11.3% | 3.7% |
| Full-time permanent/ ongoing | -0.5% | 3.6% | 0.1% | 0.1% | 4.6% | -10.8% |
| Full-time contract (fixed-term) | 7.6% | 0.6% | 15.0% | 32.2% | ||
| Part-time permanent/ongoing | 1.4% | 0.2% | 4.0% | 2.5% | 4.4% | 0.7% |
| Part-time contract (fixed-term) | 9.7% | -10.3% | 6.3% | 60.8% | ||
| Casual | 0.8% | 0.9% | 0.8% | 4.9% | 8.6% | -0.8% |
| Please note that for the pay gap in the 65+ age group 6 employees. The gap arises because 2 of the men were Senior Officers, on salaries above $150k, while the average salary for the 3 women was $66k. In total the cohort comprised 3 men and 3 women. | ||||||
3. Sexual harrassment
| 3.1 Number of formal sexual harassment complaints | ||
|---|---|---|
| Women | Men | Self described |
| 0 | 0 | 0 |
| 3.2 Gender+ Survey responses | ||
| Percentage of respondents in the organisation who experienced sexual harassment by gender | Women | Men |
| 0% | 0% | |
| Please note that we did not have a sufficient cohort of gender non-binary people respond to the survey to include in our survey results. | ||
| 3.3 I feel safe to challenge inappropriate behaviour at work | ||
 | ||
| 3.4 My organisation takes steps to eliminate bullying, harassment, and discrimination | ||
 | ||
| 3.5 My organisation encourages respectful workplace behaviours | ||
 | ||
4. Recruitment and promotion
| 4.1 My organisation makes fair recruitment and promotion decision based on merit |
|---|
 |
| 4.2 I feel I have an equal chance at promotion in my organisation |
 |
| 4.3 Gender is not a barrier to success in my organisation |
 |
| 4.4 Being Aboriginal and/or Torres Strait Islander is not a barrier to success in my organisation |
 |
| 4.5 Cultural background is not a barrier to success in my organisation |
 |
| 4.6 Sexual orientation is not a barrier to success in my organisation |
 |
| 4.7 Disability is not a barrier to success in my organisation |
 |
| 4.8 Age is not a barrier to success in my organisation |
 |
5. Leave flexibility
| 5.1 My organisation would support me if I needed to take family violence leave |
|---|
 |
| 5.2 I am confident that if I requested a flexible work arrangement it would be given due consideration |
 |
| 5.3 My organisation supports employees with family or other caring responsibilities regardless of gender |
 |
| 5.4 I have the flexibility I need to manage my work and non work activities and responsibilities |
 |
| 5.5 Using flexible work arrangements is not a barrier to success in my organisation |
 |
| 5.6 Having caring responsibilities is not a barrier to success in my organisation |
 |
| 5.7 Having family responsibilities is not a barrier to success in my organisation |
 |
6. Gendered segregation
| 6.1 Gender composition of ANZCO code major groups in organisation | ||
|---|---|---|
| Women | Men | |
| Managers | 47% | 53% |
| Professionals | 62% | 38% |
| Tech and trades | 16% | 84% |
| Community and personal services | 81% | 19% |
| Clerical and admin | 80% | 20% |
| Sales workers | 91% | 9% |
| Machinery operators | 5% | 95% |
| Labourers | 52% | 48% |
| Our data shows that our workforce continue to be highly segregated by gender according to different professions. Interestingly two professions, managers and labourers, have the most equal representation. Tech trades national gender segregation is 83 per cent male and 16 percent female, and we mirror these figures almost exactly. Our professionals, community and personal services, clerical and admin, sales and labourers categories have more women represented than national averages. Workforce gender segregation is a persistent and sticky contributor to the gender pay gap. | ||
| 6.2 My organisation uses inclusive and respectful images and language | ||
 | ||
| 6.3 In my workgroup work is allocated fairly, regardless of gender | ||
 | ||
Page last updated: