A Gender+ Survey of employee experience of inclusion was conducted in June and July 2021. Key themes from this, and the baseline Workforce Gender Audit, are analysed below.
GEAP - Establishing a baseline
Intersectional insights
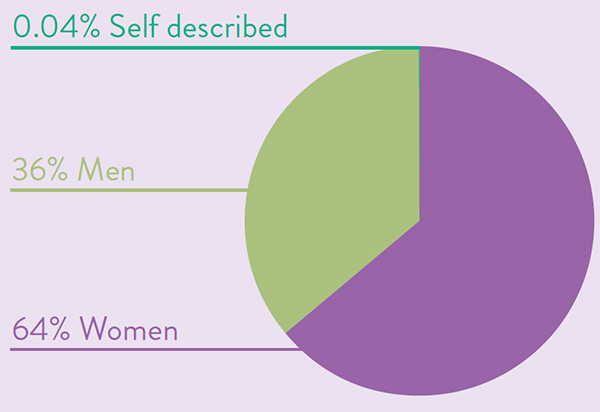
Gender breakdown of workforce
Our overall gender breakdown, excluding leaders, is weighted towards women, who also make up most of our part-time and casual workforce.
Our Community Life division, which has the greatest number of employees compared to other directorates, employs the largest proportion of women – over 81 percent. The services provided through this division include roles that would be traditionally defined as ‘caring’ roles, such as community care and early learning.
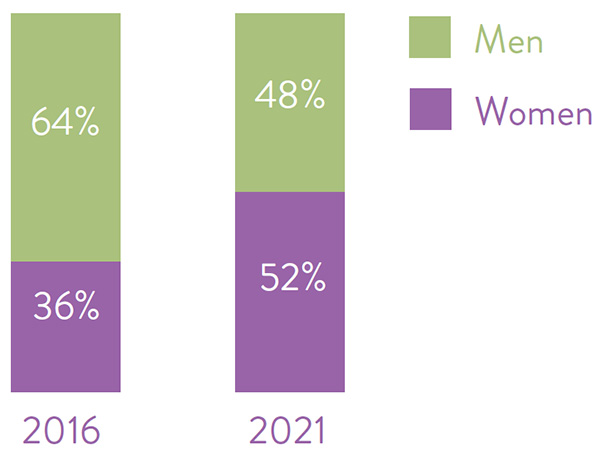
Our senior leadership team attained gender parity (52 percent women) – up from 36 percent women in 2016.
The increase in women of senior leadership
This example demonstrates the importance of being able to gain a comprehensive understanding of an organisation and to measure key gender equality indicators in order to set positive targets.
Our overall gender breakdown, excluding leaders, is weighted towards women, who also make up most of our part-time and casual workforce.
Workforce by employment basis(full-time, part-time, casual)
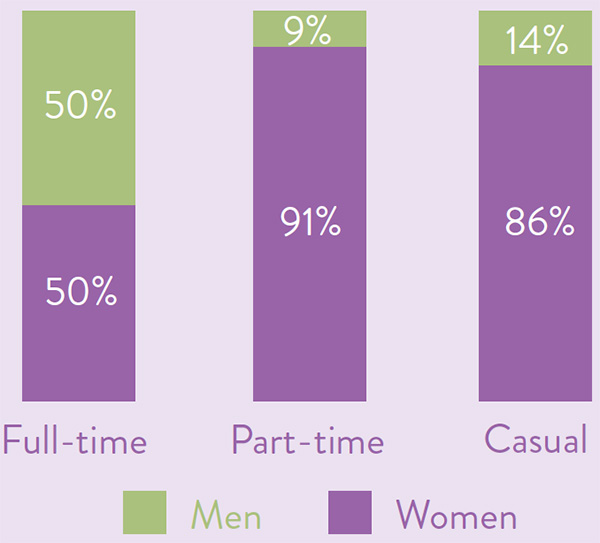
Women’s workforce participation at the City both mimics, and is impacted by, broader societal structural barriers and norms including:
- high rates of part-time work for women
- women’s time out of the workforce due to caring responsibilities, which impacts career progression and opportunities
- women’s disproportionate share of unpaid caring and domestic work.
It is important to note that segregation in workforce participation is embedded in, and reflects, economic and workforce participation in Australia and globally.
There are underlying gendered assumptions and systemic reliance on unpaid domestic duties undertaken predominantly by women contributing to this pattern. Barriers such as cost of childcare, unpaid domestic care and labour, wage differences between masculinised and feminised industries, and capacity to work more hours can pose real challenges for women to access full-time employment opportunities.
Gender pay gap
The median gender pay gap for our workforce is 4 percent, which is significantly lower than both the national average and public administration average.
According to Workplace Gender Equality Agency (WGEA) data from 2021, the national gender pay gap in Australia is 14.2 percent. The national public administration pay gap is 7.3 percent.
Despite equal pay for equal work and pay parity for our directors, variable pay gaps exist at other levels.
Gender pay gap
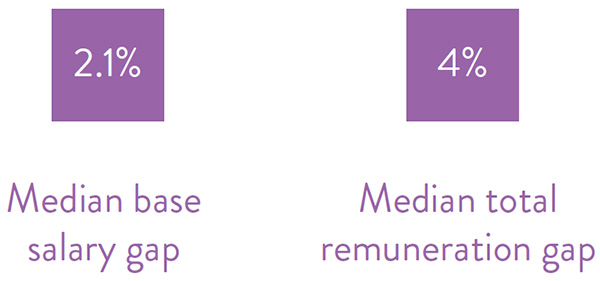
We believe that this gap is impacted by the way that different allowances are provided to different workforces across the professions and awards that guide remuneration.
Observed strengths
Since 2016, when we conducted our very first internal gender audit, the participation of women in senior leadership roles has increased. What this illustrates is the organisation’s ability to look within, learn and make positive changes.
Our capacity to make positive changes by committing to long-term initiatives is evident, and will continue. One of the key themes of the Gender+ Survey was that people in our workforce care about inclusion and diversity, and are eager to support and progress this work.
Observed opportunities
Our overall workforce gender composition has remained stable.
We’ve observed a minor shift in our part-time workforce from 84 percent women in 2016 to 85 percent in 2021. This demonstrates the difficulty of shifting some of these entrenched gender trends.
Our ability to shift structural and societal gender norms will rely on our internal ‘gender mainstreaming’ and awareness raising across the broader community. We are already addressing this in part by embedding Gender+ Impact Assessments (GIA+) in our business planning cycle, which also gives leaders and teams access to training and support that can build GIA+ capability right across our organisation.
We were unable to capture sufficient intersectional data, including gender diversity, from our audit and survey to be able to report on feedback reliably and in a manner that maintains confidentiality. This means that we have only been able to undertake very limited intersectional analysis. There is an opportunity for us to better capture intersectional data, as well as increase diversity within our workforce.
Employee feedback
NOUS Group were engaged to conduct our employee experience survey in June 2021, which we re-branded as the Gender+ Survey. The purpose of the re-branding was to distinguish from our regular employee experience surveys and to highlight intersectionality.
We received 770 responses from employees, or a response rate of 28 percent. Things like survey fatigue, adequate access to digital platforms, impacts of COVID-19 and time pressures may have contributed to the response rate.
City wide combined Gender+ Survey findings according to themes
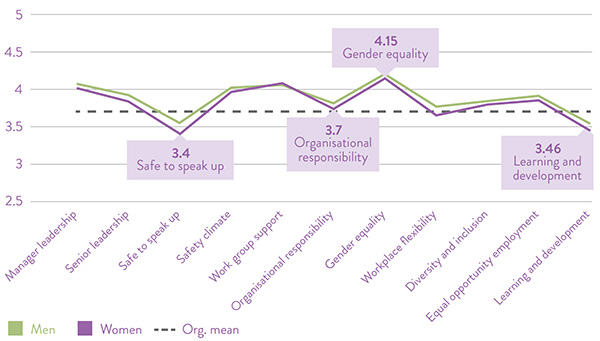
The score 3.7 represents the mean for responses (neutral). The higher the score, the more positive the response ('agree' and 'strongly agree'). The lower the score, the more negative the response ('disagree' and 'strongly disagree').
As the graph (above) shows, our Gender+ Survey respondents identified a number of strengths, including senior leadership, manager leadership, peer support and a safe workplace environment. Awareness and sense of gender equality and equal opportunity employment also ranked well above our mean.
A number of areas were identified as needing improvement, in particular the way we enable employees to speak up and the way we ensure equitable opportunities for career development and growth – in particular, in looking at part-time leadership and job share positions.
I’d like to see more part-time manager/coordinator type roles to promote gender diversity in management positions.
Respect those wishing to work part time and provide fair opportunities for work advancement and day-to-day work type opportunities that are consistent across the organisation.
Supporting parents to work part time in leadership roles. Currently you cannot progress into a leadership role if you are part time or wanting flexible arrangements.
Create more opportunities for people to network and collaborate.
There has been a decline in the rate of workplace bullying and harassment witnessed and experienced over the past several years. Survey responses indicated that incorporating more of a trauma-informed and person-centred approach to complaint handling would assist complainants to feel more supported.
Deal with bullying and harassment issues quickly and effectively to stamp out bad behaviour and improve the culture.
Ensure employees who experience bullying have support from HR and the organisation.
Respond to workplace bullying to ensure staff feel safe at work.
Generally, respondents reported their work groups were supportive, but they would look to peers and friends for support in the case of a negative workplace experience. This indicates that we need to continue building responses and a culture that is trustworthy and reliable.
Access to employment options, part-time versus full-time work, and workplace flexibility respondents specified a desire to see and access more part-time and/or job share leadership opportunities. Respondents also expressed a desire for more diverse leave options that consider age, time of life, culture and religion.
Part-time work was identified as a particularly important option by male respondents. Community Life, our largest directorate employing over 1,400 people and more than 80 percent women, illustrates that a large proportion of our part-time workforce is involved in what are seen as traditionally female or ‘caring professions’. We know that there is a desire in our field workforce to have more opportunity for part- time flexibility.
Identified challenges
Improve data capabilities
We have observed some key data gaps, which have limited a more comprehensive intersectional analysis. Specific gaps are highlighted below. The aim is to resolve these with the introduction of a new Human Capital Management System in the 2021–22 financial year.
Our Gender+ Survey was also the first time that intersectional indicators were sought. Most respondents completed the information about different identifiers, but over 6 percent of respondents did not. This may indicate that they did not feel safe or confident that their information would remain confidential. We anticipate our long-term commitment to cultural development, as part of the Working Better Together initiative and our Inclusion and Diversity Roadmap, should improve this over time.
Workforce diversity
Our current Human Capital Management System does not gather intersectional identifiers of recruits and employees. This has impacted our ability to identify impacts of compounding challenges and biases.
Our Gender+ Survey respondents also indicate that they feel our organisation supports inclusion and diversity. And consultation with stakeholders has confirmed that improving the diversity of our workforce is a valuable opportunity.
Bring more diversity in senior leadership group and hear all employees and take action accordingly to meet their needs.
Develop and implement a plan to ensure greater diversity and representation in our leadership teams.
Ensuring Management/Director level represent diversity. Particularly in regard to showing young women that there are opportunities for them higher up the organisational ladder.
Workforce reporting
Our Human Capital Management System is due to be upgraded in 2022. Currently, we use separate platforms for and recruits and, to date, have only asked for limited information about applicant gender and other identifiers. The new system will help us capture more sophisticated information about applicant, recruit and employee identifiers through a more comprehensive and centralised platform. This will significantly enhance our intersectional reporting capabilities.
Reporting on learning and development
Currently, growth and development opportunities are captured on an individual level – as part of people’s workplans – but are not tracked comprehensively by a Human Capital Management System. The planned upgrade to the system in 2022 will enable us to track regular performance and development reviews and improve our tracking of learning and development activities. This, in turn, will support more robust planning of, and access to, learning and development opportunities for all employees.
Accessibility and inclusion reporting
The Commission for Gender Equality in the Public Sector workplace gender audit guidelines have not provided a sufficient definition of the types of conditions/disabilities captured under the banner of 'disability' for reporting purposes. The current Human Captital Management System combines employees with disabilities and identified medical conditions in the same category. This will be improved in the new system.
Flexibility data
Workplace flexibility is also another category that is difficult to track. The reporting period occurred during the COVID pandemic, an extraordinary time when most employees were working from home and required to incorporate creative flexible arrangements to undertake home schooling, caring and other responsibilities.
Digital inclusion
Digital inclusion is an area that has not been captured by the audit, but identified through consultation with employee networks to have impacted the capacity of some staff to actively participate in the Gender+ Survey.
Page last updated: